The trace tells it back
A JSONL trace is honest and unreadable in roughly equal measure. The store has been load-bearing since the replay post: append-only, one record per line, the whole run reconstructible from the file. It is also a wall of JSON, and evidence that demands squinting does not get read. Today the harness grew a reader:
python -m agent_harness.inspect out/run.jsonl
What it prints
The run, as a timeline. This is real output from a run whose tool flaked once on its second step:
run.jsonl · 11 transitions · 3 checkpoints · final: done

   1  step 0  plan → act             step planned                 tool=echo
   2  step 0  act → verify           result produced
   3  step 0  verify → checkpoint    verified                   checkpoint
   4  step 1  plan → act             step planned                 tool=echo
   5  step 1  act → act              transient error, retrying  retry  error=network hiccup
   6  step 1  act → verify           result produced
   7  step 1  verify → checkpoint    verified                   checkpoint
   8  step 2  plan → act             step planned                 tool=echo
   9  step 2  act → verify           result produced
  10  step 2  verify → checkpoint    verified                   checkpoint
  11  step 3  plan → done            goal met

retries: 1 · escalations: 0 · checkpoints: 3
replay: clean · seq gapless · every checkpoint verified
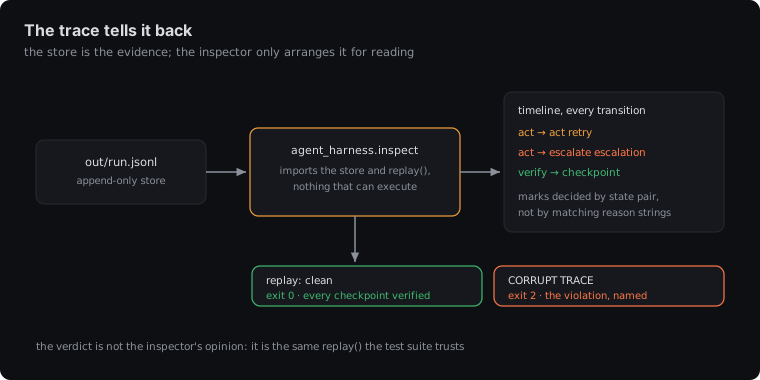
The marks in the right column come from a small table keyed by state
pair. An act → act edge is a retry because the state machine says
it is, not because a string in the reason field looked retry-ish.
The taxonomy classified the failure when it happened; the inspector
only has to read the classification back.
Tool-free by construction
The inspector imports the store and replay(), and nothing else. It
has no way to execute a tool, so pointing it at a trace can never
change anything, and the verdict on the last line comes from the
same replay() the test suite trusts, run over the same file. A
trace that fails those invariants prints CORRUPT TRACE, names the
violation, and exits 2, so a script or a CI job can gate on the
story holding together.
What it refuses to show
Control flow, not payloads. Checkpoint results stay in the file; the timeline shows what the machine did, never what the tools returned. Payloads are where size and privacy live, and a viewer for them is a different tool with different problems. The story of a run — planned, acted, retried, verified, escalated — fits in eighty-four lines of reader precisely because it declines to be a browser.
Ledger
952 lines of harness, of which the inspector is 84. Four new tests bring the suite to 292, still green in half a second. Version 0.3.4. The reader was built one errand ahead of the first real trace it exists to read; the README’s count on that errand stands at fifteen days.